
The Weight of Tomato Waste
The Weight of Tomato Waste
The Weight of Tomato Waste

Team
Team
Course
Course
Supervisors
Supervisors
Morgan Bath, Travis Erickson, Pan Xie, Pranav Miglani, & Yining Wang
Morgan Bath, Travis Erickson, Pan Xie, Pranav Miglani, & Yining Wang
Understanding Systems (SFIN-6011), OCAD University, Winter 2024
Understanding Systems (SFIN-6011), OCAD University, Winter 2024
Lorraine Randell
Lorraine Randell
My Role
Project management lead; co-developed the visual and storytelling approach with Travis, who executed the design. Presented the map at Systems Thinking Ontario (with Travis, July 2024) and independently at RSD13 (October 2024), where it was published in the proceedings.
Project management lead; co-developed the visual and storytelling approach with Travis, who executed the design. Presented the map at Systems Thinking Ontario (with Travis, July 2024) and independently at RSD13 (October 2024), where it was published in the proceedings.
The Question
Who carries the weight of tomato waste?
We arrived at it the long way. An earlier project had mapped the global fresh tomato supply system, and one theme kept surfacing at every stage — cultivation, harvest, transport, retail, disposal. Waste was not an event at the end of the chain. It was distributed through the whole thing, and different people absorbed the cost of it at every point.
So the question was never really about tomatoes. It was about who pays.
Who carries the weight of tomato waste?
We arrived at it the long way. An earlier project had mapped the global fresh tomato supply system, and one theme kept surfacing at every stage — cultivation, harvest, transport, retail, disposal. Waste was not an event at the end of the chain. It was distributed through the whole thing, and different people absorbed the cost of it at every point.
So the question was never really about tomatoes. It was about who pays.
The System Before the Map
The foundation came from an earlier inquiry into global food supply, narrowed deliberately to fresh tomatoes: widely consumed, culturally significant almost everywhere, and complicated enough at every stage to open onto much larger questions about labour, transport, and agricultural sustainability.
We built that understanding through four tools.
Iterative inquiry to scope the problem and decide what we were not looking at.
A stakeholder map plotting relationships between actors by the knowledge they hold and the power they hold — which is where the shape of the problem first became visible.
A system life cycle analysis map, adapting a framework normally used to trace a product's resource use, to follow stakeholders through production, cultivation, consumption, and disposal instead.
A causal loop diagram, from which we isolated story loops on pest and disease control and on working conditions.
That groundwork is why the second project could move quickly. We already knew where the system's pressure points were.
The foundation came from an earlier inquiry into global food supply, narrowed deliberately to fresh tomatoes: widely consumed, culturally significant almost everywhere, and complicated enough at every stage to open onto much larger questions about labour, transport, and agricultural sustainability.
We built that understanding through four tools.
Iterative inquiry to scope the problem and decide what we were not looking at.
A stakeholder map plotting relationships between actors by the knowledge they hold and the power they hold — which is where the shape of the problem first became visible.
A system life cycle analysis map, adapting a framework normally used to trace a product's resource use, to follow stakeholders through production, cultivation, consumption, and disposal instead.
A causal loop diagram, from which we isolated story loops on pest and disease control and on working conditions.
That groundwork is why the second project could move quickly. We already knew where the system's pressure points were.
What We Found
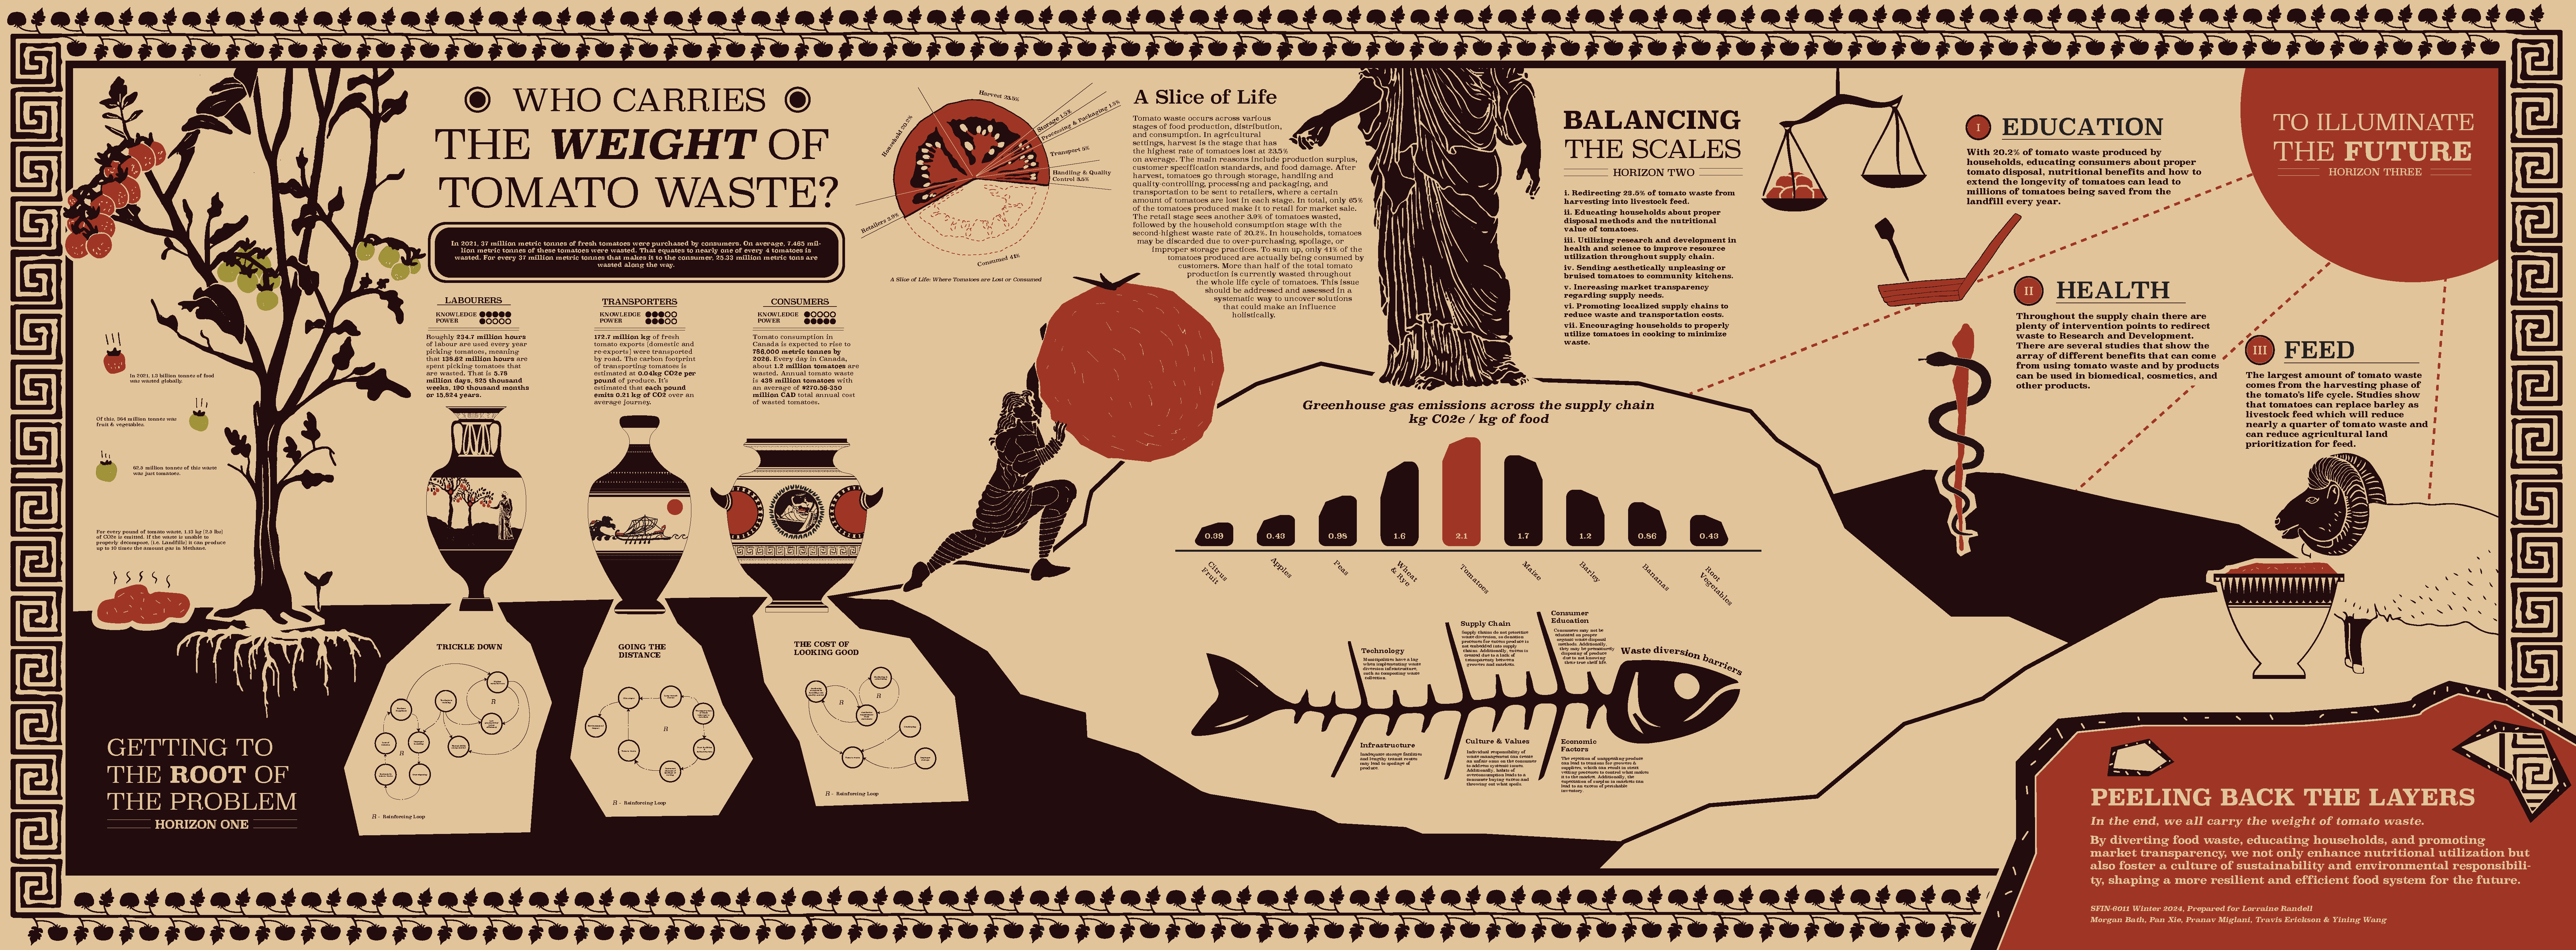
In 2021, 1.3 billion tonnes of food was wasted globally. Fruit and vegetables accounted for 364 million tonnes of it, and the single largest contributor in that category was tomatoes, at 62.5 million tonnes.
Roughly one in every four tomatoes purchased is thrown away. Across the full lifecycle, only 41 percent of tomatoes produced are ever eaten.
The losses are spread across the chain rather than concentrated at the end. Harvest is the largest single stage at 23.5 percent, lost to production surplus, customer specification standards, and damage. Only 65 percent of tomatoes produced reach retail at all. Retail loses another 3.9 percent. Households lose 20.2 percent, the second-highest stage, to over-purchasing, spoilage, and improper storage.
And every pound of tomato waste emits 1.13 kg of CO2e. If it cannot decompose properly, as in landfill, it produces up to ten times that in methane.
In 2021, 1.3 billion tonnes of food was wasted globally. Fruit and vegetables accounted for 364 million tonnes of it, and the single largest contributor in that category was tomatoes, at 62.5 million tonnes.
Roughly one in every four tomatoes purchased is thrown away. Across the full lifecycle, only 41 percent of tomatoes produced are ever eaten.
The losses are spread across the chain rather than concentrated at the end. Harvest is the largest single stage at 23.5 percent, lost to production surplus, customer specification standards, and damage. Only 65 percent of tomatoes produced reach retail at all. Retail loses another 3.9 percent. Households lose 20.2 percent, the second-highest stage, to over-purchasing, spoilage, and improper storage.
And every pound of tomato waste emits 1.13 kg of CO2e. If it cannot decompose properly, as in landfill, it produces up to ten times that in methane.
Three Loops, Three Stakeholders
Rather than treat waste as one problem, we developed story loops around three stakeholders, each holding a different combination of knowledge and power.
Trickle Down — labourers
Labourers hold the deepest hands-on knowledge in the system and almost none of the decision-making power. Inadequate training wastes their time and potential, which lowers productivity and leads to mishandling. Growers lose revenue. Under-used workers leave for better opportunities, and turnover disrupts the workforce, which makes training harder still.
The economics are stark. Tomato industry sales total roughly 181.74 million USD annually, with 24.7 percent going to labour. Wasted tomatoes mean wasted labour: roughly 15.1 million USD in labour costs, or 138.62 million hours a year.
Going the Distance — transporters
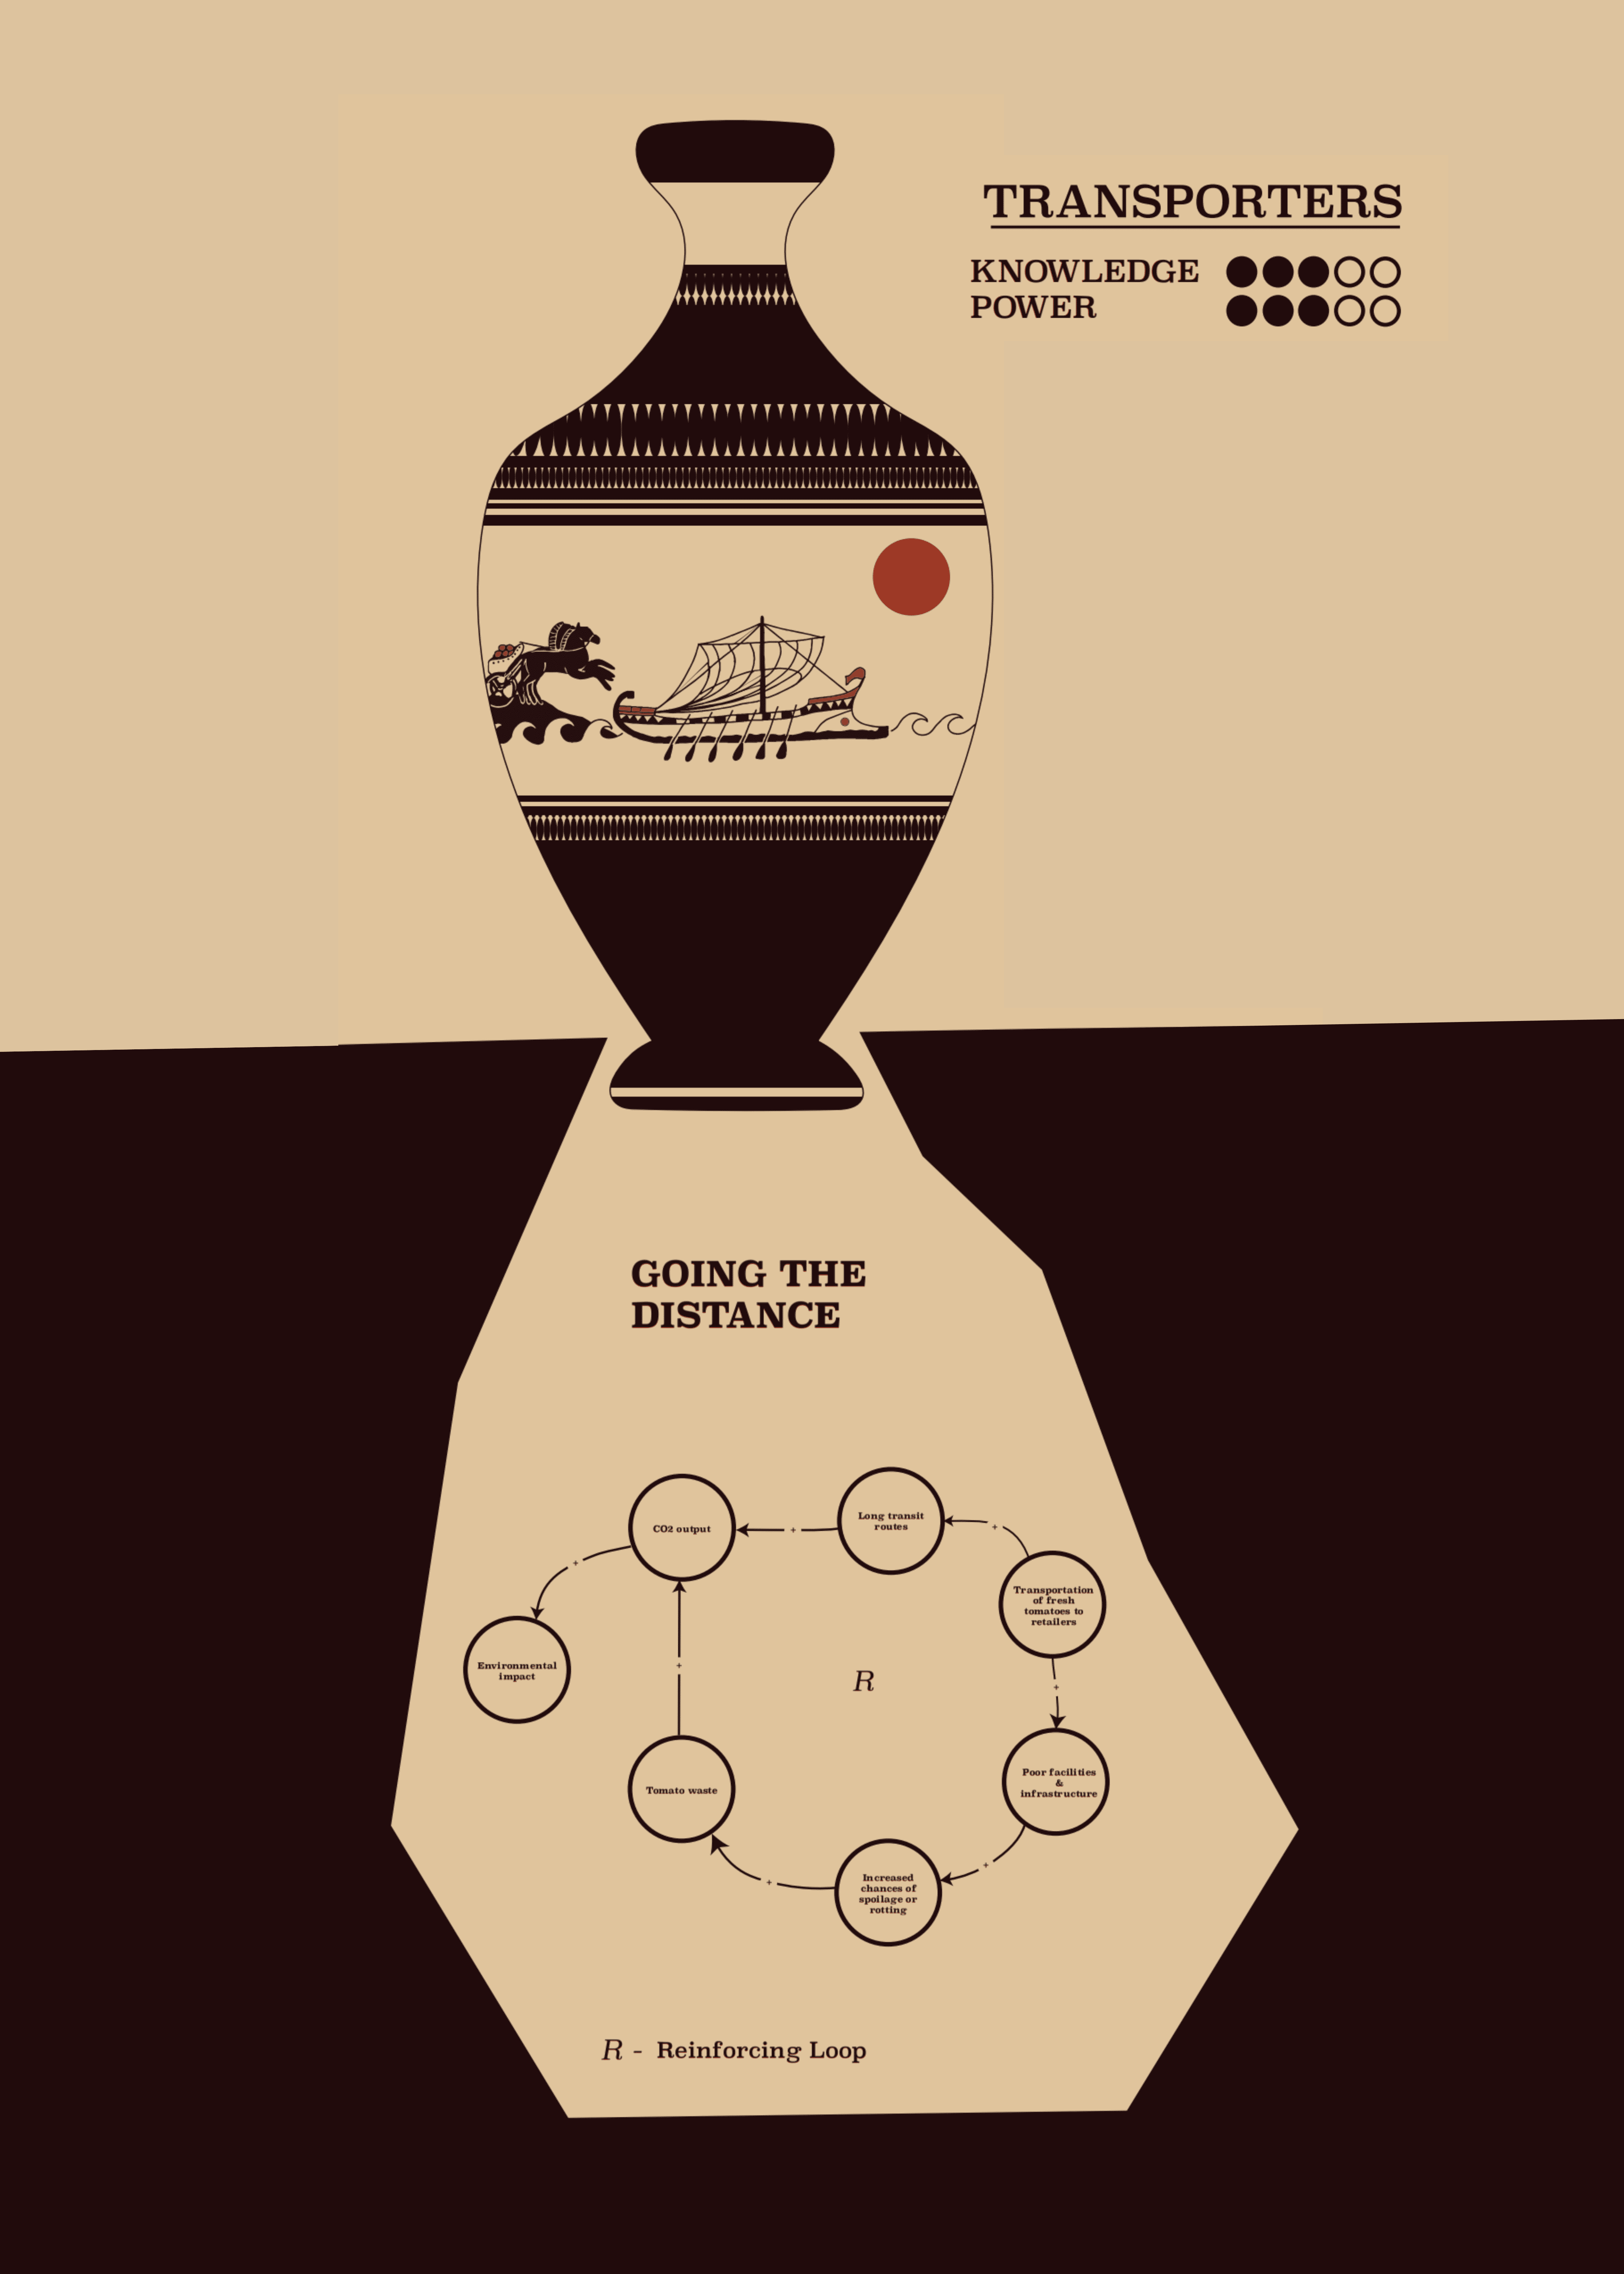
Transporters hold both knowledge and power, but their view of environmental consequence is constrained by regulation, market demand, and existing infrastructure. Long, inefficient routes damage delicate fruit and emit continuously. Spoilage rises with transit time and poor storage. As demand grows, the cycle becomes harder to sustain.
In 2020, Canada moved 172.7 million kg of fresh tomatoes by road. Road transport accounts for 82 percent of Canada's domestic transportation-related greenhouse gas emissions.
The Cost of Looking Good — consumers and retail
Consumers know least about how tomatoes are produced and hold the most market power. Their preference for flawless fruit leads retailers to stock only what looks good, and to overstock so shelves stay full. Both produce waste before anyone has bought anything.
In Canada, roughly 1.2 million tomatoes are discarded daily — 438 million a year — at an annual cost between 271.56 and 350 million CAD.
Rather than treat waste as one problem, we developed story loops around three stakeholders, each holding a different combination of knowledge and power.
Trickle Down — labourers
Labourers hold the deepest hands-on knowledge in the system and almost none of the decision-making power. Inadequate training wastes their time and potential, which lowers productivity and leads to mishandling. Growers lose revenue. Under-used workers leave for better opportunities, and turnover disrupts the workforce, which makes training harder still.
The economics are stark. Tomato industry sales total roughly 181.74 million USD annually, with 24.7 percent going to labour. Wasted tomatoes mean wasted labour: roughly 15.1 million USD in labour costs, or 138.62 million hours a year.
Going the Distance — transporters
Transporters hold both knowledge and power, but their view of environmental consequence is constrained by regulation, market demand, and existing infrastructure. Long, inefficient routes damage delicate fruit and emit continuously. Spoilage rises with transit time and poor storage. As demand grows, the cycle becomes harder to sustain.
In 2020, Canada moved 172.7 million kg of fresh tomatoes by road. Road transport accounts for 82 percent of Canada's domestic transportation-related greenhouse gas emissions.
The Cost of Looking Good — consumers and retail
Consumers know least about how tomatoes are produced and hold the most market power. Their preference for flawless fruit leads retailers to stock only what looks good, and to overstock so shelves stay full. Both produce waste before anyone has bought anything.
In Canada, roughly 1.2 million tomatoes are discarded daily — 438 million a year — at an annual cost between 271.56 and 350 million CAD.

Trickle Down — labourers
Labourers hold the deepest hands-on knowledge in the system and almost none of the decision-making power. Inadequate training wastes their time and potential, which lowers productivity and leads to mishandling. Growers lose revenue. Under-used workers leave for better opportunities, and turnover disrupts the workforce, which makes training harder still.
The economics are stark. Tomato industry sales total roughly 181.74 million USD annually, with 24.7 percent going to labour. Wasted tomatoes mean wasted labour: roughly 15.1 million USD in labour costs, or 138.62 million hours a year.
Trickle Down — labourers
Labourers hold the deepest hands-on knowledge in the system and almost none of the decision-making power. Inadequate training wastes their time and potential, which lowers productivity and leads to mishandling. Growers lose revenue. Under-used workers leave for better opportunities, and turnover disrupts the workforce, which makes training harder still.
The economics are stark. Tomato industry sales total roughly 181.74 million USD annually, with 24.7 percent going to labour. Wasted tomatoes mean wasted labour: roughly 15.1 million USD in labour costs, or 138.62 million hours a year.
Going the Distance — transporters
Transporters hold both knowledge and power, but their view of environmental consequence is constrained by regulation, market demand, and existing infrastructure. Long, inefficient routes damage delicate fruit and emit continuously. Spoilage rises with transit time and poor storage. As demand grows, the cycle becomes harder to sustain.
In 2020, Canada moved 172.7 million kg of fresh tomatoes by road. Road transport accounts for 82 percent of Canada's domestic transportation-related greenhouse gas emissions.
Going the Distance — transporters
Transporters hold both knowledge and power, but their view of environmental consequence is constrained by regulation, market demand, and existing infrastructure. Long, inefficient routes damage delicate fruit and emit continuously. Spoilage rises with transit time and poor storage. As demand grows, the cycle becomes harder to sustain.
In 2020, Canada moved 172.7 million kg of fresh tomatoes by road. Road transport accounts for 82 percent of Canada's domestic transportation-related greenhouse gas emissions.

The Cost of Looking Good — consumers and retail
Consumers know least about how tomatoes are produced and hold the most market power. Their preference for flawless fruit leads retailers to stock only what looks good, and to overstock so shelves stay full. Both produce waste before anyone has bought anything.
In Canada, roughly 1.2 million tomatoes are discarded daily — 438 million a year — at an annual cost between 271.56 and 350 million CAD.
The Cost of Looking Good — consumers and retail
Consumers know least about how tomatoes are produced and hold the most market power. Their preference for flawless fruit leads retailers to stock only what looks good, and to overstock so shelves stay full. Both produce waste before anyone has bought anything.
In Canada, roughly 1.2 million tomatoes are discarded daily — 438 million a year — at an annual cost between 271.56 and 350 million CAD.
The Design Decision
The data was fascinating and immense. The problem with immense data is that it rarely moves anyone.
So we started with the story rather than the numbers. What was actually happening in this system, and what would someone need to understand in order to feel it? From there we worked backwards into the research, choosing the figures and hard truths that carried the story rather than the ones that were simply available. Only then did we design.
Three decisions shaped the final map.
Greek myth as the spine. An in-class brainstorm surfaced an unlikely pairing between Greek mythology and tomato waste, and it stuck. Sisyphus pushing his boulder uphill became the endless push of tomatoes toward the consumer. The consumer then places them on an unbalanced scale, carrying the imbalance of consumption. Myth gave a supply chain a shape people could hold in their heads.
Painted Greek pottery as the visual language. Stakeholders are rendered as vases and pots. The underground layer of the scene holds root problems and introduces the story loops, so the causes sit literally beneath the surface. Supporting data lives in the same world: a comparison of CO2e emissions across popular produce, and a fishbone diagram identifying what blocks waste diversion — municipal lag in composting infrastructure, inadequate storage, supply chains with no donation pathway, the cultural habit of placing systemic responsibility on individuals, gaps in consumer education, and economic incentives that reward surplus and reject imperfect fruit.
Three Horizons as the reader's route. The map is set on three hills, and they are not decorative. We used the Three Horizons framework to structure the user journey: horizon one, on the left, holds the problems stakeholders face now. Horizon two, through the centre, holds waste diversion opportunities. Horizon three, on the right, resolves those opportunities into three areas of future action. A reader moves left to right and travels from present problem to future action without being told they are doing it.
We worked out the visual approach together: what the elements would be, where they would sit, and the story they would tell. Travis executed the design in Adobe.
The data was fascinating and immense. The problem with immense data is that it rarely moves anyone.
So we started with the story rather than the numbers. What was actually happening in this system, and what would someone need to understand in order to feel it? From there we worked backwards into the research, choosing the figures and hard truths that carried the story rather than the ones that were simply available. Only then did we design.
Three decisions shaped the final map.
Greek myth as the spine. An in-class brainstorm surfaced an unlikely pairing between Greek mythology and tomato waste, and it stuck. Sisyphus pushing his boulder uphill became the endless push of tomatoes toward the consumer. The consumer then places them on an unbalanced scale, carrying the imbalance of consumption. Myth gave a supply chain a shape people could hold in their heads.
Painted Greek pottery as the visual language. Stakeholders are rendered as vases and pots. The underground layer of the scene holds root problems and introduces the story loops, so the causes sit literally beneath the surface. Supporting data lives in the same world: a comparison of CO2e emissions across popular produce, and a fishbone diagram identifying what blocks waste diversion — municipal lag in composting infrastructure, inadequate storage, supply chains with no donation pathway, the cultural habit of placing systemic responsibility on individuals, gaps in consumer education, and economic incentives that reward surplus and reject imperfect fruit.
Three Horizons as the reader's route. The map is set on three hills, and they are not decorative. We used the Three Horizons framework to structure the user journey: horizon one, on the left, holds the problems stakeholders face now. Horizon two, through the centre, holds waste diversion opportunities. Horizon three, on the right, resolves those opportunities into three areas of future action. A reader moves left to right and travels from present problem to future action without being told they are doing it.
We worked out the visual approach together: what the elements would be, where they would sit, and the story they would tell. Travis executed the design in Adobe.
Iterations
The map went through three distinct versions, and the report documents all of them.
First iteration. Rough, hand-built, worked out in plasticine, marker, and paper to test whether the metaphor could carry the data at all.
The map went through three distinct versions, and the report documents all of them.
First iteration. Rough, hand-built, worked out in plasticine, marker, and paper to test whether the metaphor could carry the data at all.

Second iteration. The Greek pottery aesthetic arrives, the hills take shape, and the data begins finding its place inside the scene rather than sitting beside it.
Second iteration. The Greek pottery aesthetic arrives, the hills take shape, and the data begins finding its place inside the scene rather than sitting beside it.
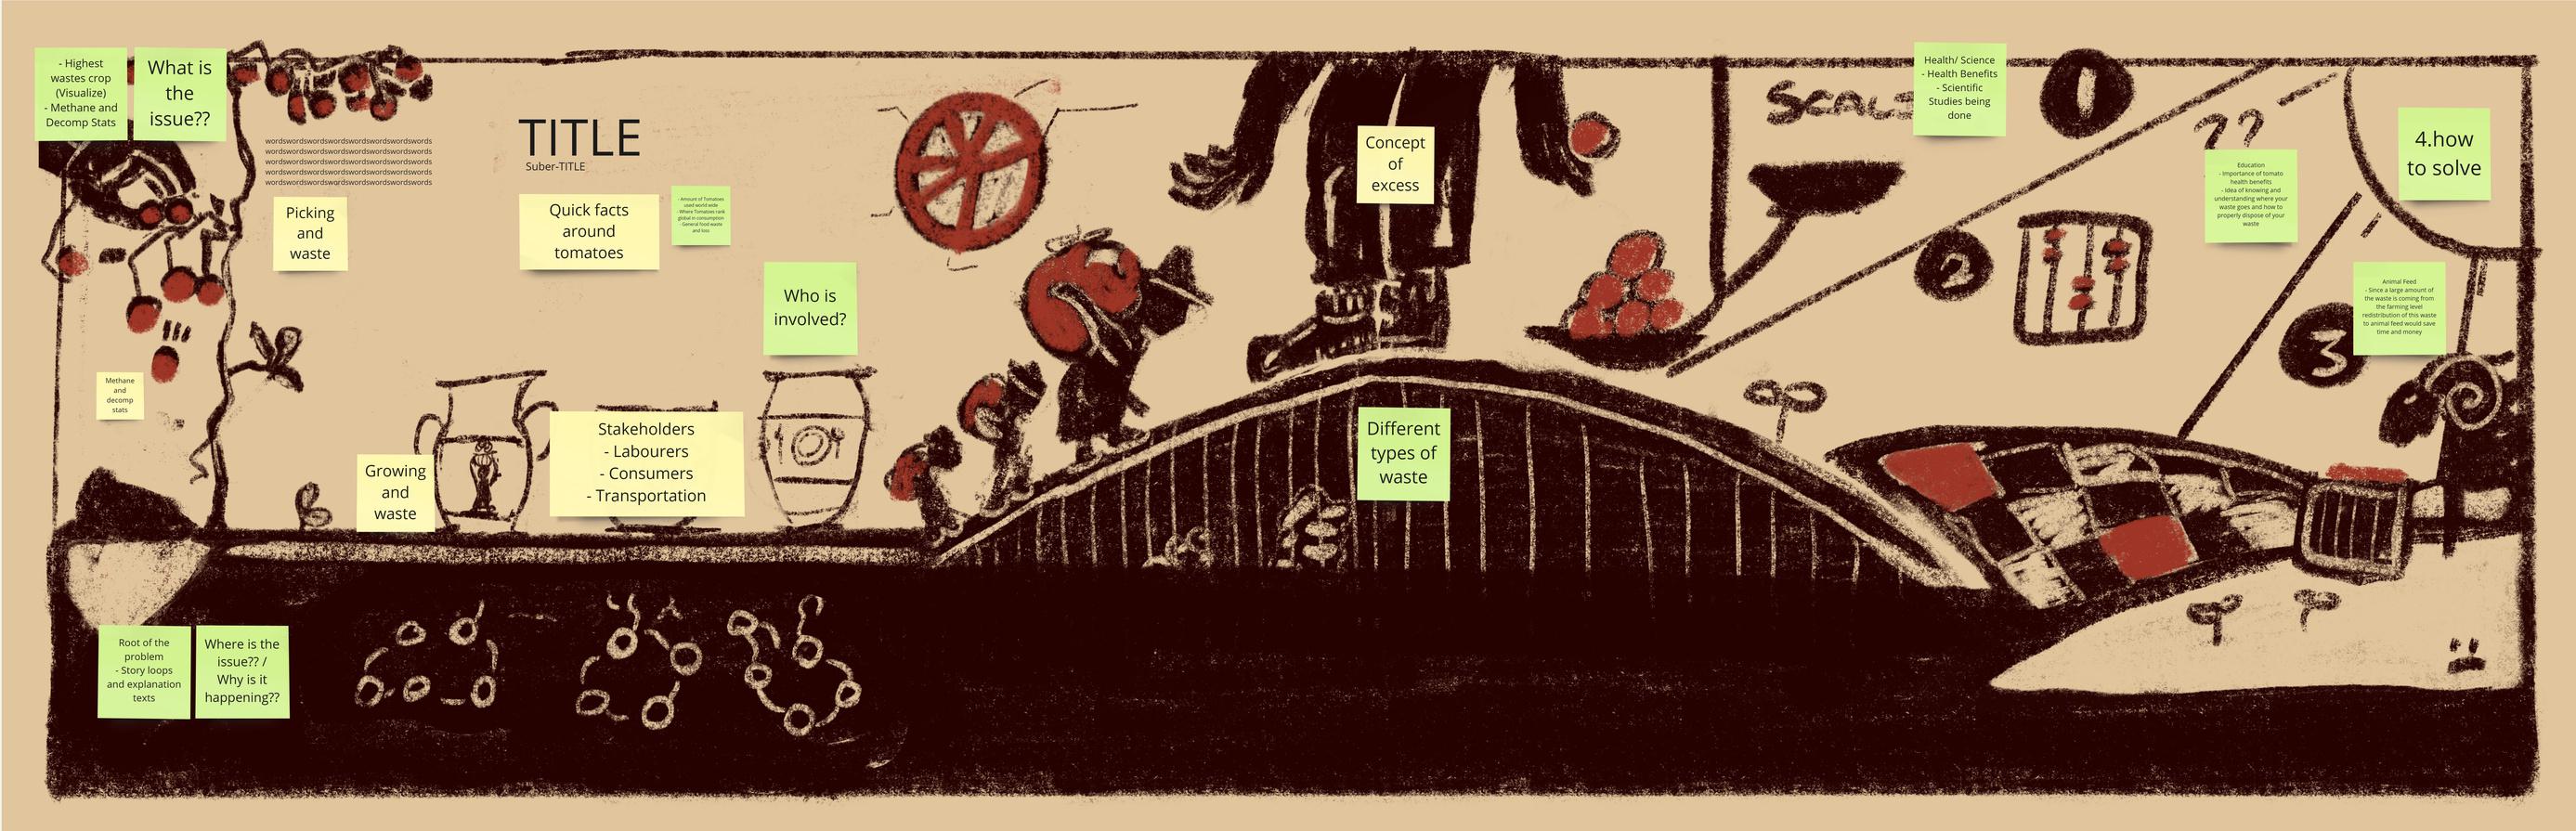
Final. The full synthesis map: story loops underground, stakeholders as vessels, three horizons carrying the reader across the composition, supporting diagrams integrated into the world rather than appended to it.
Final. The full synthesis map: story loops underground, stakeholders as vessels, three horizons carrying the reader across the composition, supporting diagrams integrated into the world rather than appended to it.
Where it Landed
Seven interventions came out of the analysis, converging on three leverage points.
Education. Households produce 20.2 percent of tomato waste. Teaching proper disposal, nutritional value, and how to extend shelf life could keep millions of tomatoes out of landfill each year.
Health. Waste can be redirected to research and development, where tomato by-products already have demonstrated uses in biomedical and cosmetic applications.
Feed. The harvest stage produces the largest share of waste, and studies show tomatoes can replace barley as livestock feed — cutting nearly 25 percent of tomato waste and reducing the land given over to feed crops.
The remaining interventions address redistribution of imperfect produce to food banks and charities, greater market transparency about supply needs, localized supply chains, and household cooking practices.
The map was presented at Systems Thinking Ontario in July 2024, followed by a 45-minute participatory inquiry session, and at RSD13 in October 2024, where the work was published in the proceedings.
Seven interventions came out of the analysis, converging on three leverage points.
Education. Households produce 20.2 percent of tomato waste. Teaching proper disposal, nutritional value, and how to extend shelf life could keep millions of tomatoes out of landfill each year.
Health. Waste can be redirected to research and development, where tomato by-products already have demonstrated uses in biomedical and cosmetic applications.
Feed. The harvest stage produces the largest share of waste, and studies show tomatoes can replace barley as livestock feed — cutting nearly 25 percent of tomato waste and reducing the land given over to feed crops.
The remaining interventions address redistribution of imperfect produce to food banks and charities, greater market transparency about supply needs, localized supply chains, and household cooking practices.
The map was presented at Systems Thinking Ontario in July 2024, followed by a 45-minute participatory inquiry session, and at RSD13 in October 2024, where the work was published in the proceedings.
Reflection
The lasting lesson was about narrative. Mapping a system that large produces more findings than anyone can absorb, and the temptation is to show all of it. What made this work was finding the underlying thread first — that waste is not an endpoint but a weight distributed unevenly across everyone in the chain — and then letting that thread decide what belonged on the page.
In the end, we all carry the weight of tomato waste.
The lasting lesson was about narrative. Mapping a system that large produces more findings than anyone can absorb, and the temptation is to show all of it. What made this work was finding the underlying thread first — that waste is not an endpoint but a weight distributed unevenly across everyone in the chain — and then letting that thread decide what belonged on the page.
In the end, we all carry the weight of tomato waste.


